Teaching the 2016 Election: Youth Participation in Elections, Part II
by Shawn Healy, PhD, Civic Learning Scholar
Last week, we laid the groundwork for youth participation in elections. Today, we take a historic view of the subject, and then apply it to the 2016 Election.
Let’s begin with the notion that voting is unique when compared to other forms of civic participation like volunteering, contacting public officials, or keeping up with political news. It’s the one thing that most of us do (at least every four years) and it’s the most equitable form of civic participation. Moreover, it doesn’t serve as a gateway drug in that the act of voting leads to other forms of participation.
Since 18 year olds were granted the right to vote in 1972, youth turnout has always lagged that of their elders. Voting tends to follow a life-cycle effect, starting slow and peaking in the plus-65 population before leveling off late in life. Youth turnout does ebb and flow over time, as it does across the electorate, largely responsive to the competitiveness of a given election.
According to the Center for Information Research on Civic Learning and Engagement (CIRCLE), the high water mark in recent election cycles was 2008 when 51% of youth 18-29 voted. This fell to 45% in 2012, whereas it dropped off only slightly among 30-44 year olds (62% to 60%) and 45-64 year olds (69% to 68%). Turnout actually increased 2% among senior citizens (70% to 72%).
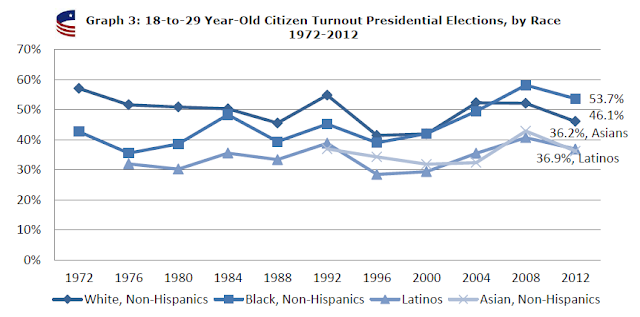
There are significant demographic cleavages among youth voters, with young women voting at a greater clip than men (48.6% versus 41.5% in 2012), and youth with some college doubling up those with none (55.9% versus 28.6%). Race is more complicated in that black youth eclipsed their white counterparts the past two cycles, but Asian and Latino youth lag significantly behind.
 |
| Source: CIRCLE's tabulations from the CPS Nov. Voting and Registration Supplements, 1972-2012 |
Specific to Illinois, youth turnout has fallen in tandem with the adult population as a whole as Illinois has morphed from a purple to blue state in presidential cycles. 43.8% of Illinois youth voted in 2012, trailing the 45% national average and ranking 30th among the 50 state and District of Columbia. Nationally, youth turnout in battleground states was 49.7%, but only 42.8% in non-competitive states. Thus, Illinois suffers from its deep hue of blue.
The good news is that youth turnout in Illinois was up 24% in the 2016 presidential primaries compared to 2008. 508,200 young people participated compared to 378,000 eight years earlier. Two-thirds of youth voters selected Democratic ballots, constituting 17% of Democratic primary voters, and a whopping 86% of them voted for Vermont Senator Bernie Sanders.
It’s no secret that Democratic nominee Hillary Clinton has struggled to consolidate the youth component of the Obama/ Sanders Coalition. While Clinton is considered a lock in Illinois, youth are expected to be decisive in deciding traditional battleground states, including neighboring Iowa and Wisconsin, along with New Hampshire, Pennsylvania, Ohio, and Colorado.
Moreover, the outcomes of U.S. Senate contests in Illinois, Wisconsin, Indiana, Pennsylvania, and New Hampshire hinge on the youth vote, ultimately determining party control of the upper chamber.
Finally, while the Republican majority in the House appears safely insulated, youth are expected to turn the tide in several competitive races, including the 13th district in Illinois which encompasses college students from the University of Illinois in Champaign-Urbana, Illinois State University, and the University of Illinois-Springfield.


Comments
Post a Comment